Client overview
Our client is a South Korean company that provides data solutions for software development in the autonomous vehicle industry. They support global automotive manufacturers and technology providers with the data pipelines needed to train and validate Advanced Driver Assistance Systems (ADAS).
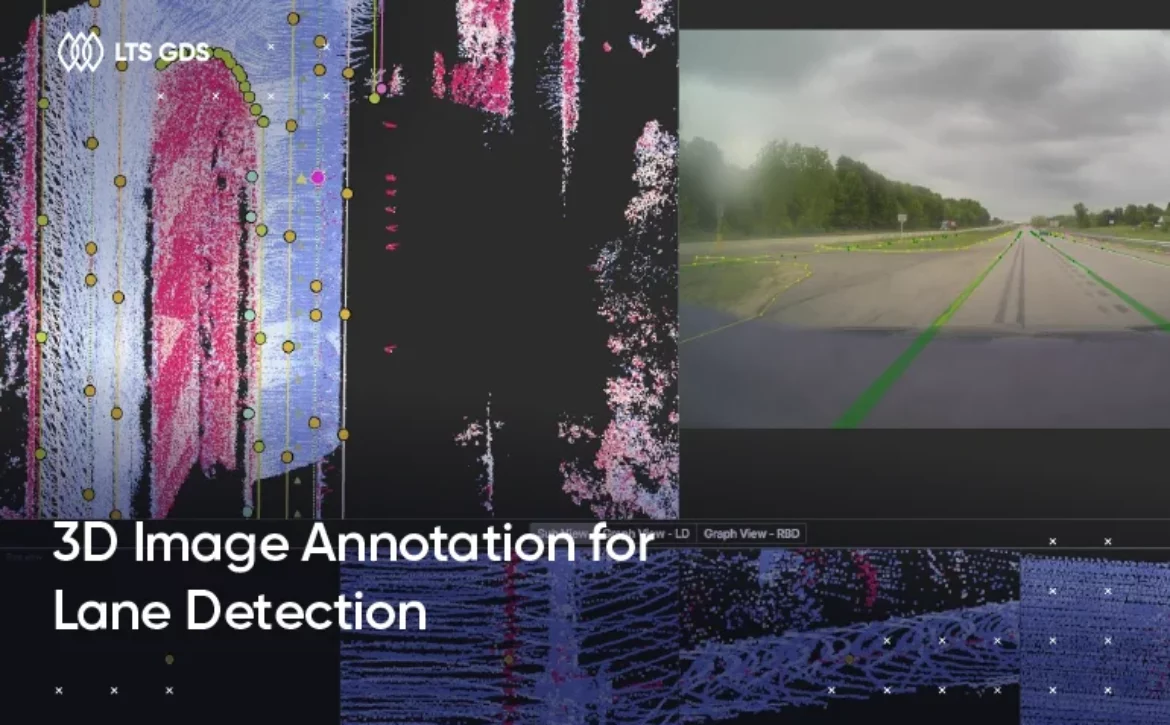
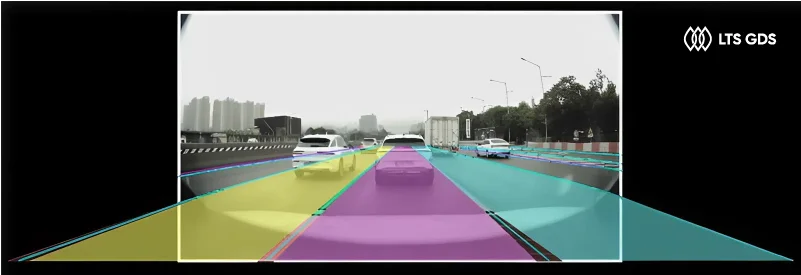
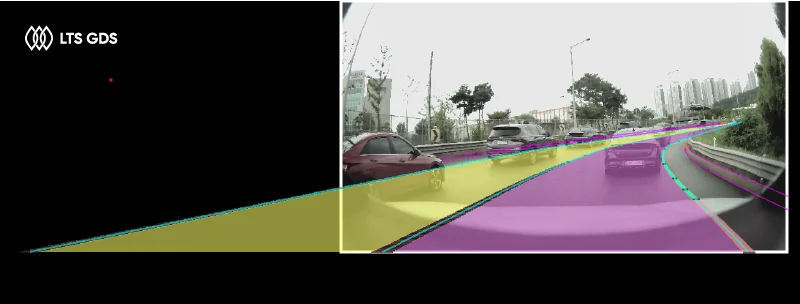
ADAS systems rely on high-quality labeled data, the client needed a reliable partner to help process a large dataset of road scenes captured from multiple countries. The focus of this project was on annotating driving lanes, which is a crucial component for systems that enable lane departure warnings, lane keeping, and autonomous navigation.
What the client needs
The client’s objective was straightforward but demanding:
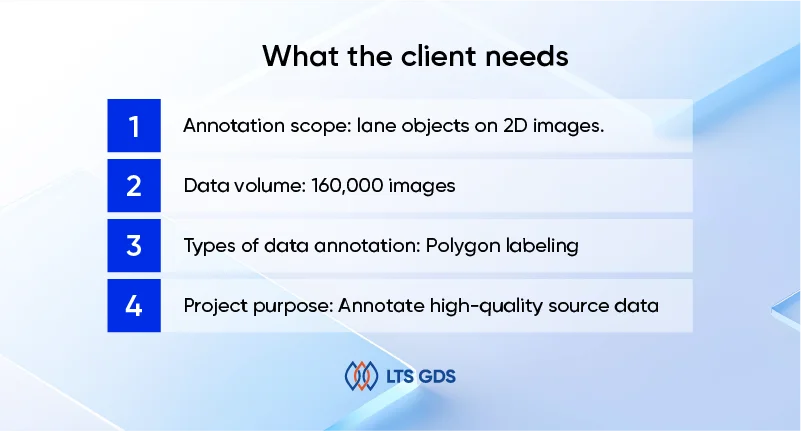
Annotation scope:
Identify and annotate lane objects on 2D images.
Data volume:
More than 160,000 images were collected from different countries, covering highways, city streets, and rural roads.
Types of data annotation:
Polygon labeling, which allows precise capture of curved and irregular lane boundaries.
Project purpose:
Annotate high-quality source data to train ADAS systems that require accurate lane boundary recognition across varied road conditions.
The key challenges in this request were scale, precision, and consistency. Lane boundaries are often complex, changing shape depending on camera angle, lighting, road wear, and country-specific markings. To be useful in training ADAS systems, the annotations had to achieve both high accuracy and uniform quality across the entire dataset.
How we did it
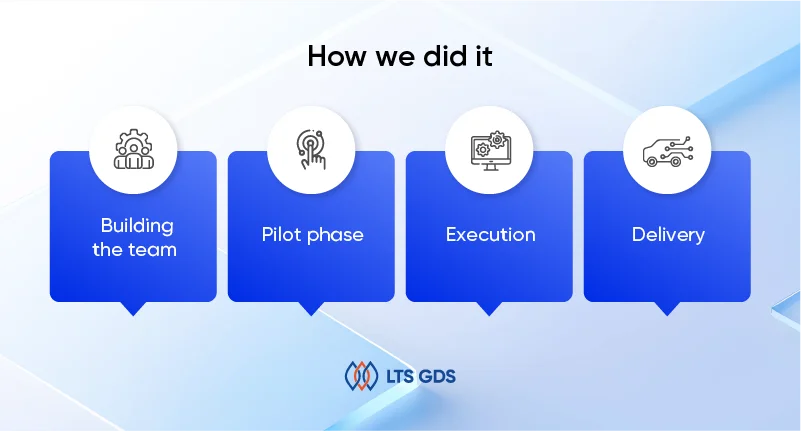
1. Building the team
We built a dedicated team of 12 annotators with prior experience in polygon annotation. Each member was carefully selected for their experience with complex visual tasks.
Before execution, we conducted targeted training to ensure consistency:
-Understanding lane marking variations across different countries.
-Best practices for polygon annotation, especially handling curves, perspective, and tapering lines.
-Guidelines for challenging cases such as faded paint, overlapping lanes, or poor visibility at night.
2. Pilot phase
We started with a pilot on a smaller dataset to test the process. Annotators labeled lane boundaries using polygons, and the results were reviewed.
Through peer checks and QA validation, we discovered variations in how broken or partially visible markings were handled. They helped us refine the annotation guidelines and retrain the team where needed.
3. Execution
After the pilot, we scaled up to full production. Each image was loaded into the platform, lanes were identified, and polygons were drawn to follow boundaries, curves, and partial markings. Annotators then did a quick self-check before submitting.
To keep quality, every annotation went through peer review, and random samples were further checked by senior QA specialists. This built-in quality loop allowed us to catch errors early without slowing down progress. By months two and three, the team was delivering large volumes daily with accuracy above 95%, and by the final month the rate exceeded 98%.
4. Delivery
After four months, the project was completed with over 160,000 images annotated using polygons and accuracy consistently above 98%. The dataset was delivered on schedule, packaged in an organized folder structure with ready-to-use annotation files. We also included clear documentation and QA reports, and held a final handover session with the client’s team to walk through the dataset and address any questions.
What the results have
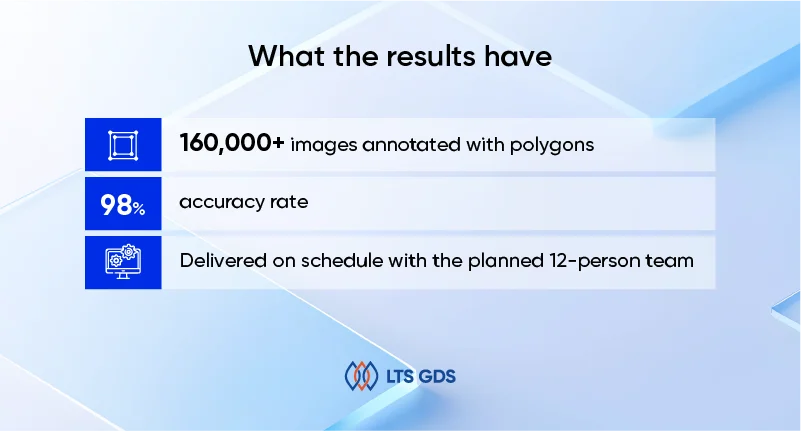
After four months, the project was completed:
-160,000+ images annotated with polygons.
-Accuracy: over 98%.
-Timeline: delivered on schedule with the planned 12-person team.